
Dear friends, I’m Christian Luis Ahumada, Founder and Chief Quantitative Analyst at Prosper Grove Asset Management. It’s a pleasure to reconnect with all of you in the group as we work together to gain insights into market trends, stay updated on the real-time movements of quality stocks, and learn practical trading techniques to enhance our hands-on trading skills.
Key Updates for Today:
1.What is the current trajectory of the stock market, and where should we focus our attention?
2.Practical Trading Technique: How to identify and apply the “double bottom” pattern.
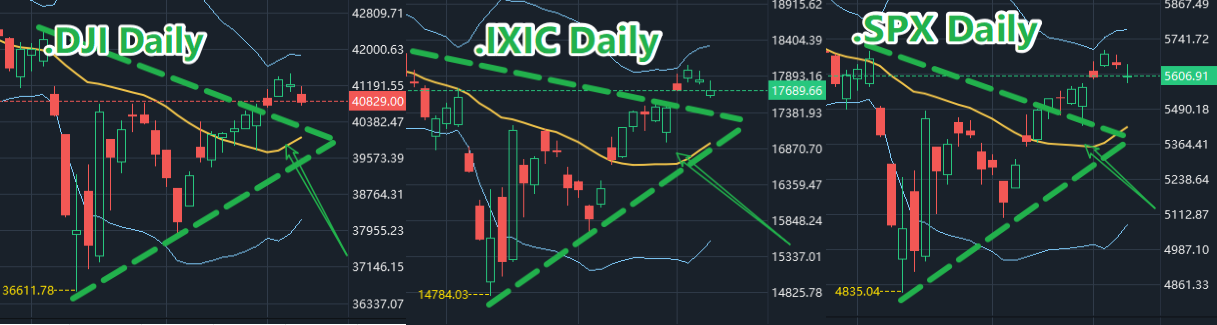
Ahead of the Federal Reserve’s policy announcement, the broader capital market has clearly shifted into risk-off mode. The Dow Jones Industrial Average fell 0.95%, the Nasdaq dropped 0.87%, and the S&P 500 declined 0.77%.
It is evident that overall market sentiment has turned cautious, with capital flowing toward defensive assets and a noticeable short-term decline in appetite for high-risk investments.
Tomorrow, the Federal Reserve will officially announce the results of its monetary policy meeting, and Chairman Powell will deliver a speech. This is not only a turning point for interest rate decisions but also a critical window for the market to assess the future path of monetary policy, especially the pace of potential rate cuts.
In the face of uncertainty, our response strategy is always clear: we must continuously and systematically advance the development and optimization of a "dynamic diversified asset allocation system," and through scientific allocation and structural balance, we will hold the line and move forward steadily in a high-volatility environment.
Friends, now let’s turn our attention to the latest developments in quality stocks.
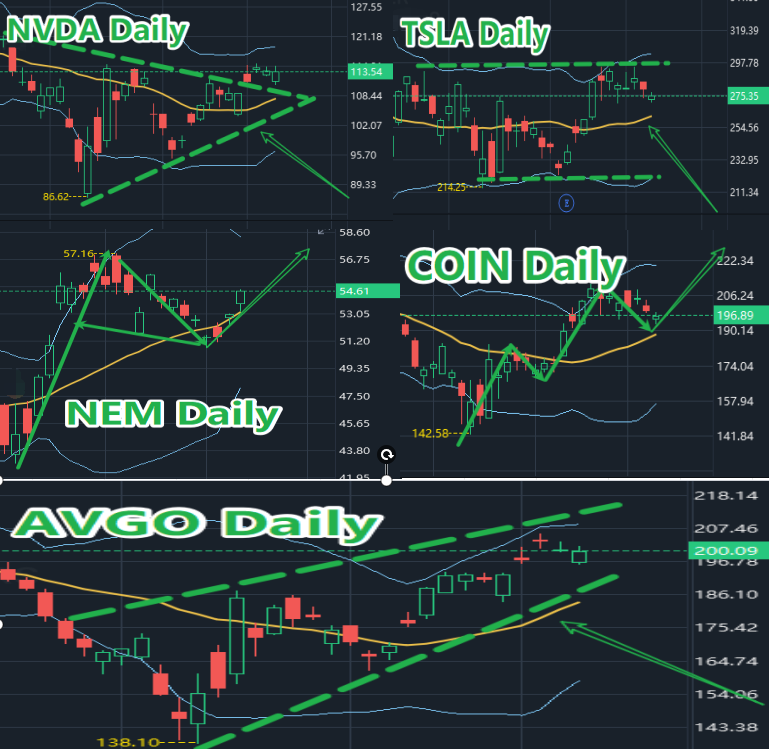
The core sectors and stocks we are focusing on include:
Artificial Intelligence: AVGO, NVDA, TSLA
Gold Sector: NEM
Cryptocurrency-related Stock: COIN
Although these stocks have experienced varying degrees of price fluctuations recently, remember this: volatility does not mean a change in trend, and a pullback does not imply a breakdown in logic.
From a broader structural perspective, they are still moving steadily within their medium- to long-term trend channels, supported by strong fundamentals and offering significant future growth potential and profit opportunities. Therefore, we choose to continue holding and wait for higher returns.
Friends, true investment winners must not only understand how to build a well-structured asset allocation system but also possess precise, practical trading skills. Therefore, during periods of market volatility, it’s essential to focus on learning and enhancing real-world trading techniques.
Dear friends, let’s begin today’s learning journey with a positive mindset.
Today’s featured practical trading technique is identifying and applying the “double bottom” pattern. I encourage everyone to study the following content carefully.
The “double bottom” pattern is a classic technical analysis formation, typically seen after a price decline followed by a rebound, then a second pullback that does not break the previous low, ultimately leading to a trend reversal to the upside. Visually, it resembles the letter “W.”
The essence of the "W" is not only its shape. It is also the beginning of "Win".
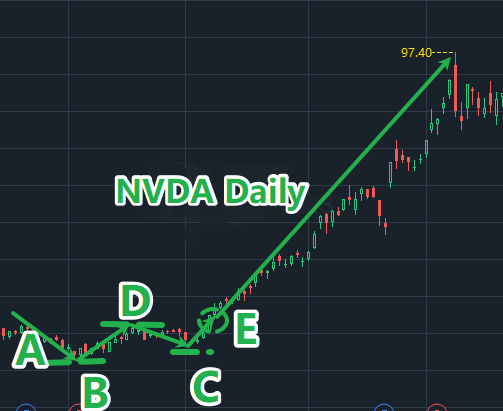
As shown in the chart: NVDA’s daily candlestick chart from November 2023 to March 2024.
Based on the pattern’s behavior, we can clearly identify three key points that define the “double bottom” formation:
1.Two low points: Point B and Point C
2.The middle high point: Point D, also known as the neckline
3.The critical Point E, which is a key breakout level and marks the beginning of a new upward trend
Friends, this classic pattern structure reflects the transformation process of the market's long and short forces. To understand it, it's not just about looking at the chart. It's also about understanding the market psychology and identifying the essential kinetic energy behind the signal.
Now I will share with you the basic principle of the "Double Bottom Pattern": the essence of the investment market is the flow of money.
1. A-B section: Affected by the macro environment, news or sectors, market sentiment panics, investors sell their chips one by one, and prices fall rapidly. With the gradual reduction of trading volume, the price reaches the low point B, showing signs of stopping the decline.
2. B-D period: Some aggressive investors begin to make small tentative purchases, funds begin to flow in, prices are gradually raised, and the profits made by these friends gradually increase.
3. Segment D to C: As the price rises, it repeatedly fails to break new highs and encounters strong resistance. Investors who have already made profits begin to gradually sell, causing the price to pull back step by step.
1. Segment C to E: After the price drops to point C, it does not continue to make new lows. Instead, there are clear signs of stabilization. The market begins to show evident signs of capital inflow again, and the price gradually rises toward point E, with the double bottom pattern starting to take shape.
5. At this moment, point E is a crucial breakout level and serves as a psychological threshold for investors.
6. Once the price successfully breaks through point E, it signals that the psychological barrier for investors has been overcome. Continued capital inflows into the market then drive the price higher.
This is a powerful signal formed by the convergence of pattern, capital, sentiment, and trend.
Dear friends, have you all grasped the content we just shared? This is the practical trading technique we focused on today: how to identify and apply the “double bottom” pattern.
I believe the content shared today will not only help enhance your technical analysis skills but also provide you with clearer decision-making logic and greater confidence in practical trading.
Please remember that there is no shortage of opportunities in the market, but what is lacking is the ability to see the trend and grasp the rhythm; skills must be repeatedly trained, cognition must be continuously improved, and real practical ability is slowly built up through each review and precipitation.
Friends, today’s session on practical trading techniques has successfully come to a close.
From your focus and feedback, I can clearly sense that each of you is continuously enhancing your understanding and building real trading strength. I believe today’s learning experience will bring valuable insights to everyone.
Tomorrow, we will face a critically important macro event: the official announcement of the Federal Reserve’s monetary policy meeting results, along with an interpretation of Chairman Powell’s remarks.
I will continue to accompany you to deeply interpret the logic behind the policy and combine the market performance to further promote the construction of our "Dynamic Diversified Asset Allocation System".
I look forward to continuing to walk with you, finding direction in the market fluctuations, and accelerating the construction of the system! See you tomorrow.