
Dear friends, I’m Christian Luis Ahumada, Founder and Quantitative Trading Analyst at Prosper Grove Asset Management. I’m glad to be here with all of you in the group as we continue to explore the impact of economic data on the investment markets, clarify the strategic direction of the market, and build a solid wealth framework.
Today's key updates:
1.What were the results of the March year-over-year PCE Price Index, and what signals did it convey?
2.How did the overall market perform, and what is our perspective?
3.Trading tip: How can we determine market trends?
According to a report released today by the Department of Commerce, the Consumer Price Index (CPI) rose only 2.3% year-over-year in March, down from 2.5% in February.
Excluding the more volatile food and energy categories, the core CPI increased by 2.6% year-over-year, also lower than February's 2.8%.
This set of data sends out important signals:
1.Inflationary pressure is gradually easing, which has helped relieve market tension.
2.As inflation declines, expectations for a Federal Reserve rate cut are rising.
The release of the PCE data generated a mildly positive sentiment in the investment markets.
However, today's other economic data revealed signs of concern: First-quarter GDP fell by 0.3%, indicating a phase of economic weakness and the early signs of contraction. April ADP private sector job growth slowed, further heightening market concerns over a cooling labor market.
Meanwhile, SMCI’s preliminary results for the third fiscal quarter came in below market expectations, with both profit and net sales falling short, raising investor worries about weakening demand for AI servers. As a result, tech stocks came under pressure.
At the moment, the stock market is being affected by economic data and earnings reports, leading to suppressed optimism and signs of panic selling.
However, I believe that the current market pullback is not a reversal of the overall trend, but rather a temporary phase of emotional release and profit-taking. The broader upward structure remains intact.
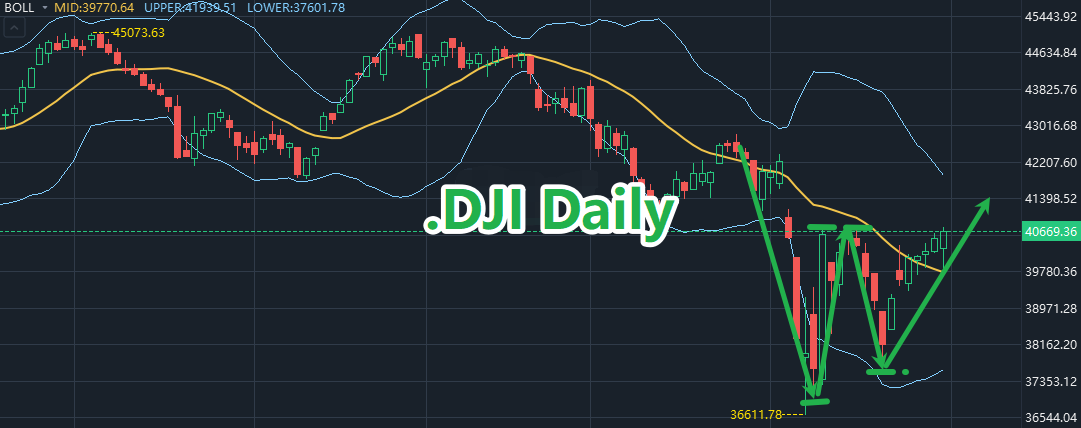
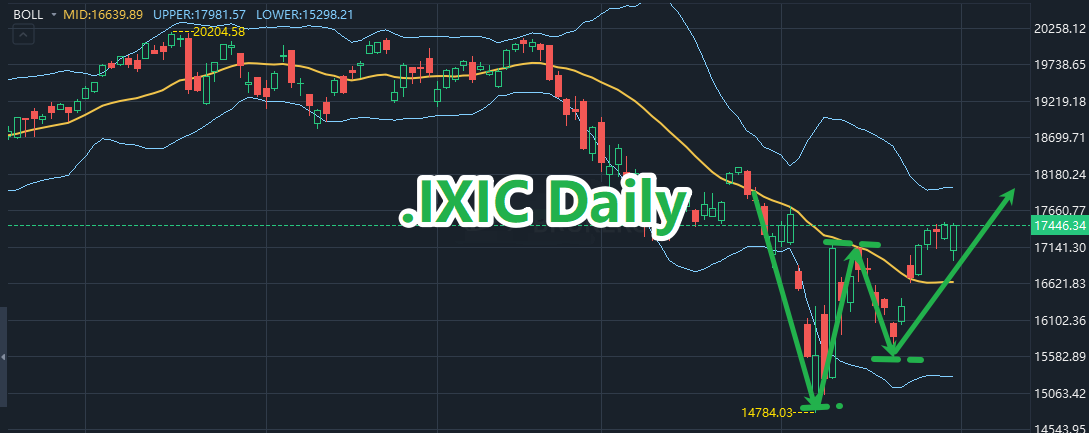
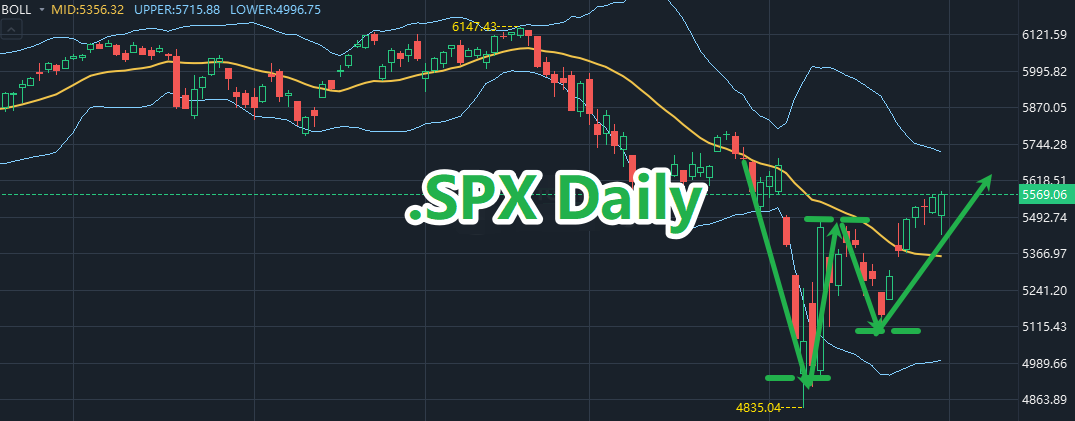
As shown in the chart: the Dow Jones Industrial Average rose by 0.35%, the Nasdaq Index declined by 0.09%, and the S&P 500 Index increased by 0.15%.
At present, although market prices have experienced a moderate short-term pullback, this does not signal a trend reversal. Rather, it represents a normal technical correction. The three major indices—the Dow Jones Industrial Average, the Nasdaq Index, and the S&P 500 Index—are still holding steadily above the middle band of the Bollinger Bands (BOLL). This not only indicates that mid-term support remains solid but also reflects that the overall market trend is still in good shape and the structure has not been compromised.
Additionally, this Friday the market is set to receive another highly significant economic data release: the Non-Farm Payroll (NFP) report.
This is a major indicator closely watched by global investors and has long been regarded as a key reference for assessing economic strength and policy direction.
The release of the NFP data often triggers sharp volatility across multiple markets including equities, gold, and crypto assets.
In light of the upcoming market turbulence, I want to especially remind everyone to stay calm and composed. Do not let short-term price fluctuations cause you to lose sight of your long-term strategic direction.
At this moment, our strategy remains clear:
1.Focus on the evolving pace of policy direction and data-driven logic.
2.Maintain a core asset allocation guided by medium- to long-term trends.
3.Use intelligent quantitative tools such as the ProMatrix Quantitative Trading System to monitor risk and optimize portfolio structure.
4.Preserve flexibility and wait for data confirmation before executing precise positioning.
Now, let’s turn our attention to the performance of four high-quality stocks we are closely monitoring in the current market:
In the artificial intelligence sector: TSLA, AVGO, and NVDA
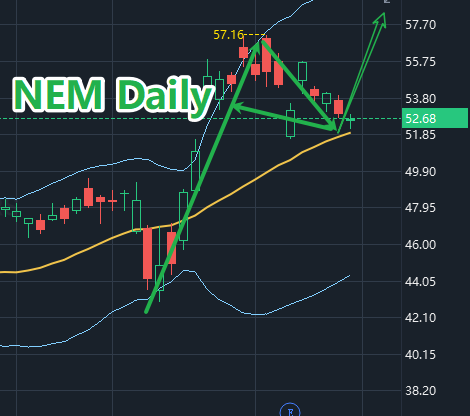
In the gold sector: NEM
From the latest chart data, we can clearly see:
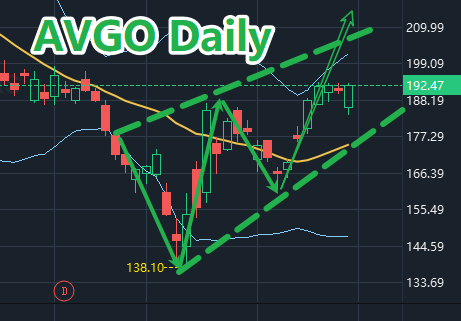
TSLA and AVGO are trading steadily above the middle band of the Bollinger Bands (BOLL), with a solid trend structure, indicating that the bulls still hold the upper hand and the overall upward pattern remains intact.
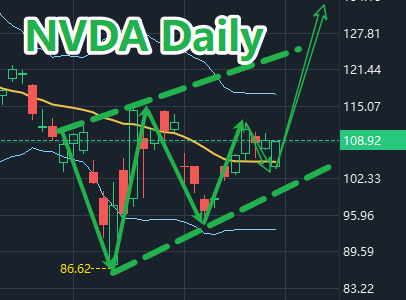
NVDA and NEM are trading near the middle band of the BOLL. Although there is slight volatility, the middle band continues to provide strong support, and no structural reversal signals have emerged.
Although all four of these high-quality stocks have experienced a brief pullback, the decline in price does not indicate a reversal in direction. The current adjustment appears to be a technical consolidation phase, building a stronger foundation for the next upward move. Moreover, the growth narratives behind these four stocks remain solid, which is why we choose to continue holding our positions.
At this moment, if you are uncertain about the future trend of the stocks you currently hold, feel free to contact our assistant to receive the latest trading strategies for high-quality stocks.
Friends, please note that I am currently using our proprietary investment tool developed by Prosper Grove Asset Management, the ProMatrix Quantitative Trading and Investment System, to conduct an in-depth market scan and intelligent screening.
At this moment, the system has identified a high-potential stock with explosive upside potential, estimated to offer around 30% profit opportunity. Once the system detects the optimal buy signal, I will immediately share the timing and strategy recommendations with everyone in the group.
If you’re interested in this potential stock, feel free to contact our assistant as soon as possible to reserve your spot.
Now, let’s begin today’s learning journey with purpose and enthusiasm.
Knowledge is our most powerful weapon against uncertainty, and trend is the guiding beacon that leads us to steady profits.
Today’s learning topic: How to identify a trend, and how to determine entry and exit points within a trend.
A trend refers to the sustained movement of price, trading volume, or market sentiment in a particular direction over a defined period of time.
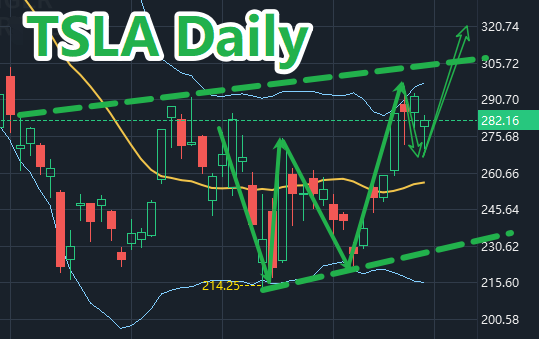
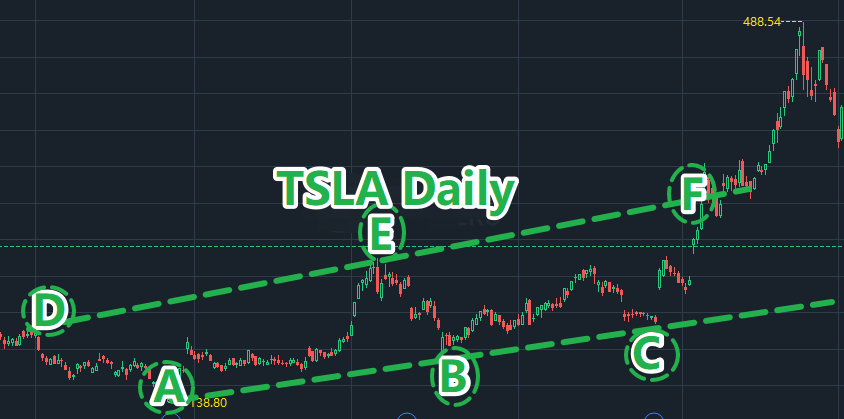
So how do we identify an uptrend? As shown in the chart: the TSLA daily candlestick chart (from March to December 2024).
Through careful observation and analysis, we can clearly see that the six key points A, B, C, D, E, and F together form a well-defined upward trend zone.
The specific method is very straightforward:
Connect points A, B, and C to form the "ascending trend support line";
Connect points D, E, and F to form the "ascending trend resistance line."
The criteria for judgment are very clear:
1.Higher highs indicate that bullish momentum continues to strengthen.
2.Higher lows suggest that market support is steadily rising, confirming a clearly upward trend direction.
At this point in the uptrend, we can extract key support and resistance levels from the structure:
Support levels: Points A, B, and C represent areas where buying strength is concentrated and are typically ideal opportunities for buying on dips.
Resistance levels: Points D, E, and F mark critical zones following short-term price increases and are often key points for taking profits or reducing positions.
Trend provides the market’s sense of direction, while key support and resistance levels serve as our operational guide. Only by understanding and applying these analytical techniques can we more effectively manage our investment portfolios, seize every profit opportunity, and better avoid risks.
In the training system of the 11th ProMatrix Quantitative Trading System Financial Training Program hosted by Prosper Grove Asset Management, we consistently follow a teaching approach that progresses from simple to complex, and from understanding to practical application.
As long as you are willing to consistently follow the daily updates in our Prosper Grove Asset Management group, including key knowledge points, strategic logic, and market opportunities, I firmly believe that you will grow into a skilled investor with independent judgment and systematic execution capabilities.
Friends, that’s all for today’s sharing. Tomorrow, we will continue to focus on the change in U.S. initial jobless claims for the week ending April 26, its impact on the investment markets, and the potential wealth opportunities it may bring. I look forward to more of you joining the discussion. See you tomorrow!